
25 Broadway 10th Floor
New York, NY 10004

Noble works across transit, subway, aviation, sports venues, and cultural institutions. These environments share a critical truth: passenger and visitor experience is directly tied to revenue and return. Delayed riders miss connections. Confused visitors miss exhibits. Frustrated fans don't renew. Experience Score closes the gap between the space you designed and the experience people actually have. The Three Dimensions We Measure:
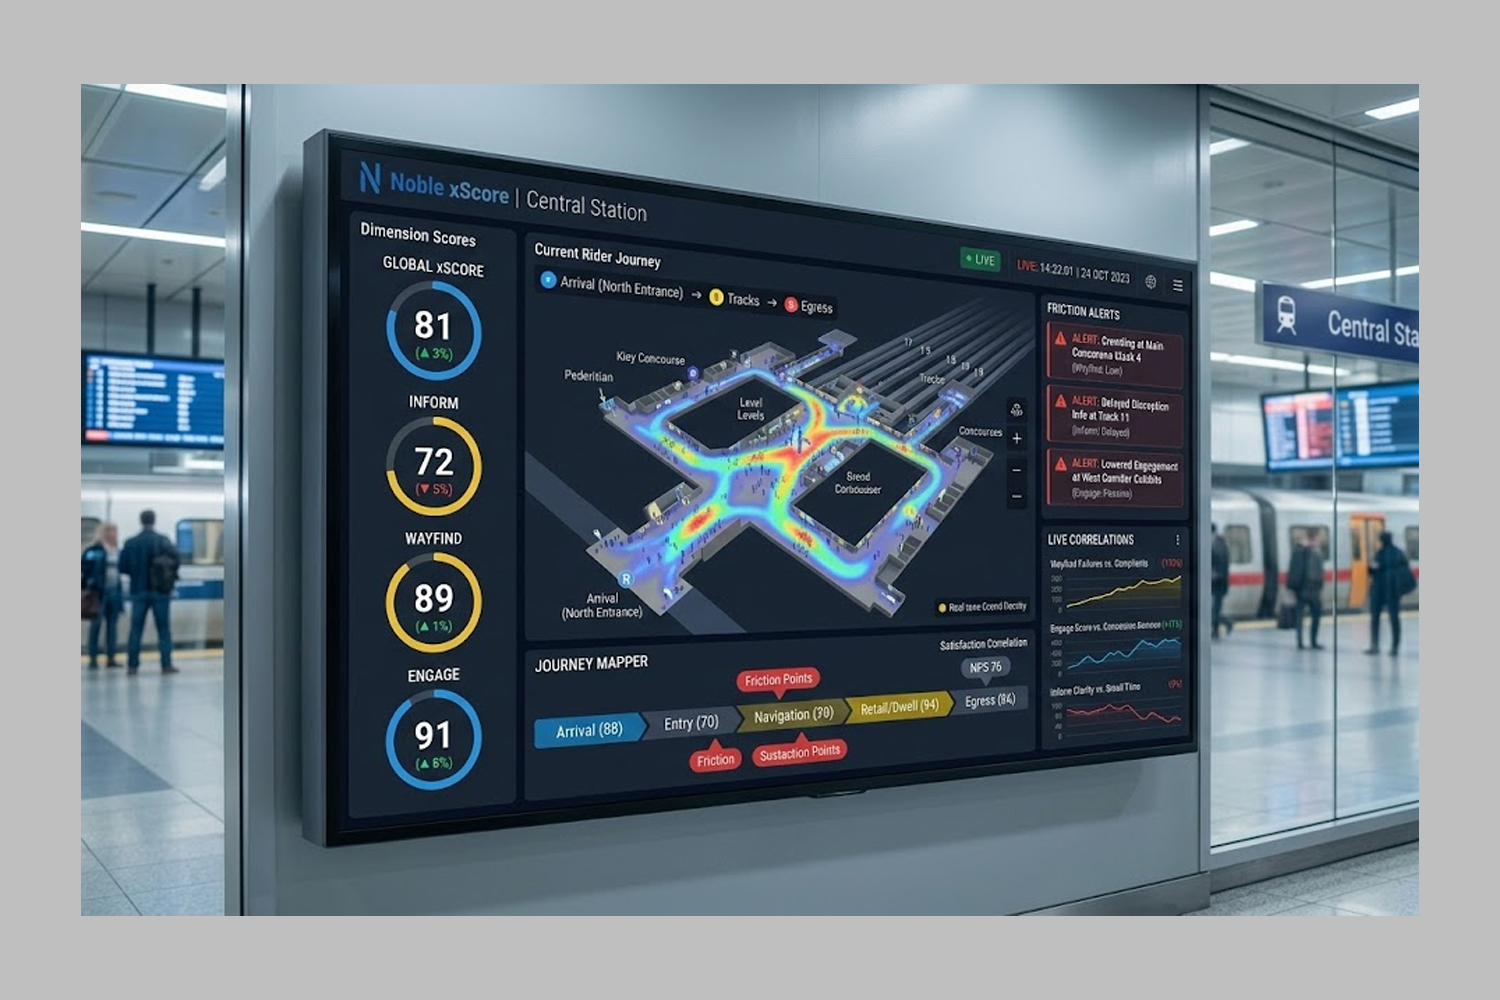
A single Experience Score synthesizes Inform, Wayfind, and Engage performance across your communications environment, environmental information density, wayfinding effectiveness, and satisfaction outcome data into one actionable metric — benchmarked against Noble's cross-sector dataset and updated continuously as conditions change.
It is the score that tells you not just where you stand, but exactly what moving it is worth.
Start with your last disruption event, your last game day, your last opening night, or your last terminal audit. Noble will show you what your visitors experienced — and what it cost you.
Inform
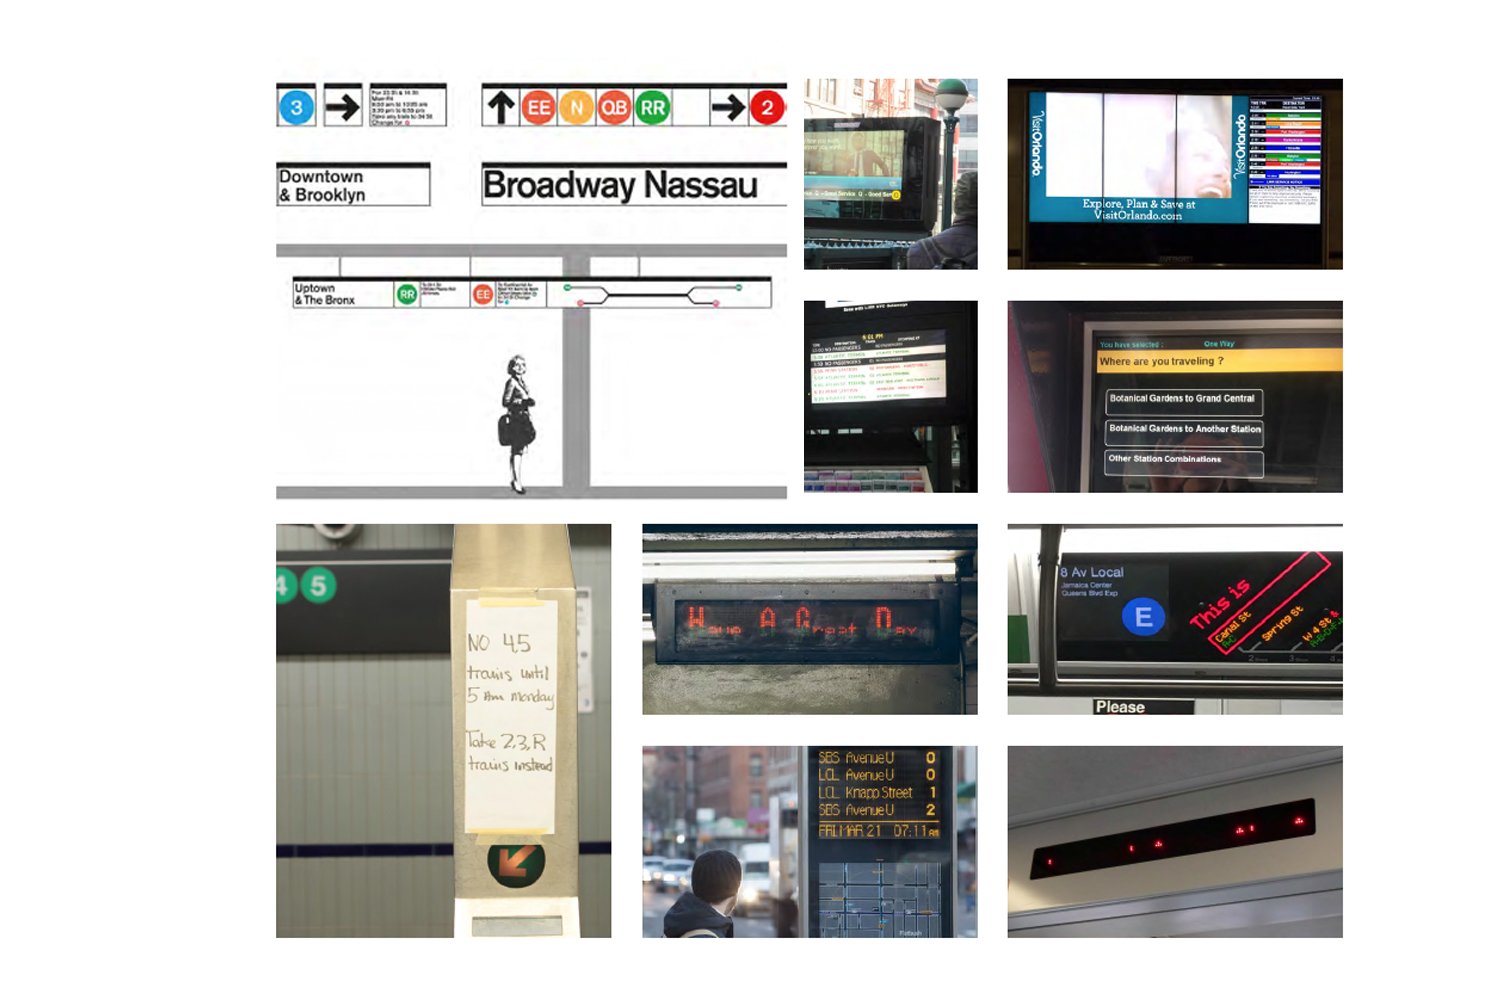
Does your space communicate essential information effectively at the moment visitors need it? Experience Score audits how well your environment delivers real-time updates on services, events, schedules, and guidelines — assessing whether critical information reaches the right person at the right point in their journey, and whether it is clear enough to act on under real conditions. In transit this means disruption messaging. In aviation it means gate and connection updates. In cultural institutions it means exhibit descriptions, event schedules, and visitor guidelines that orient and prepare rather than overwhelm.
Wayfind
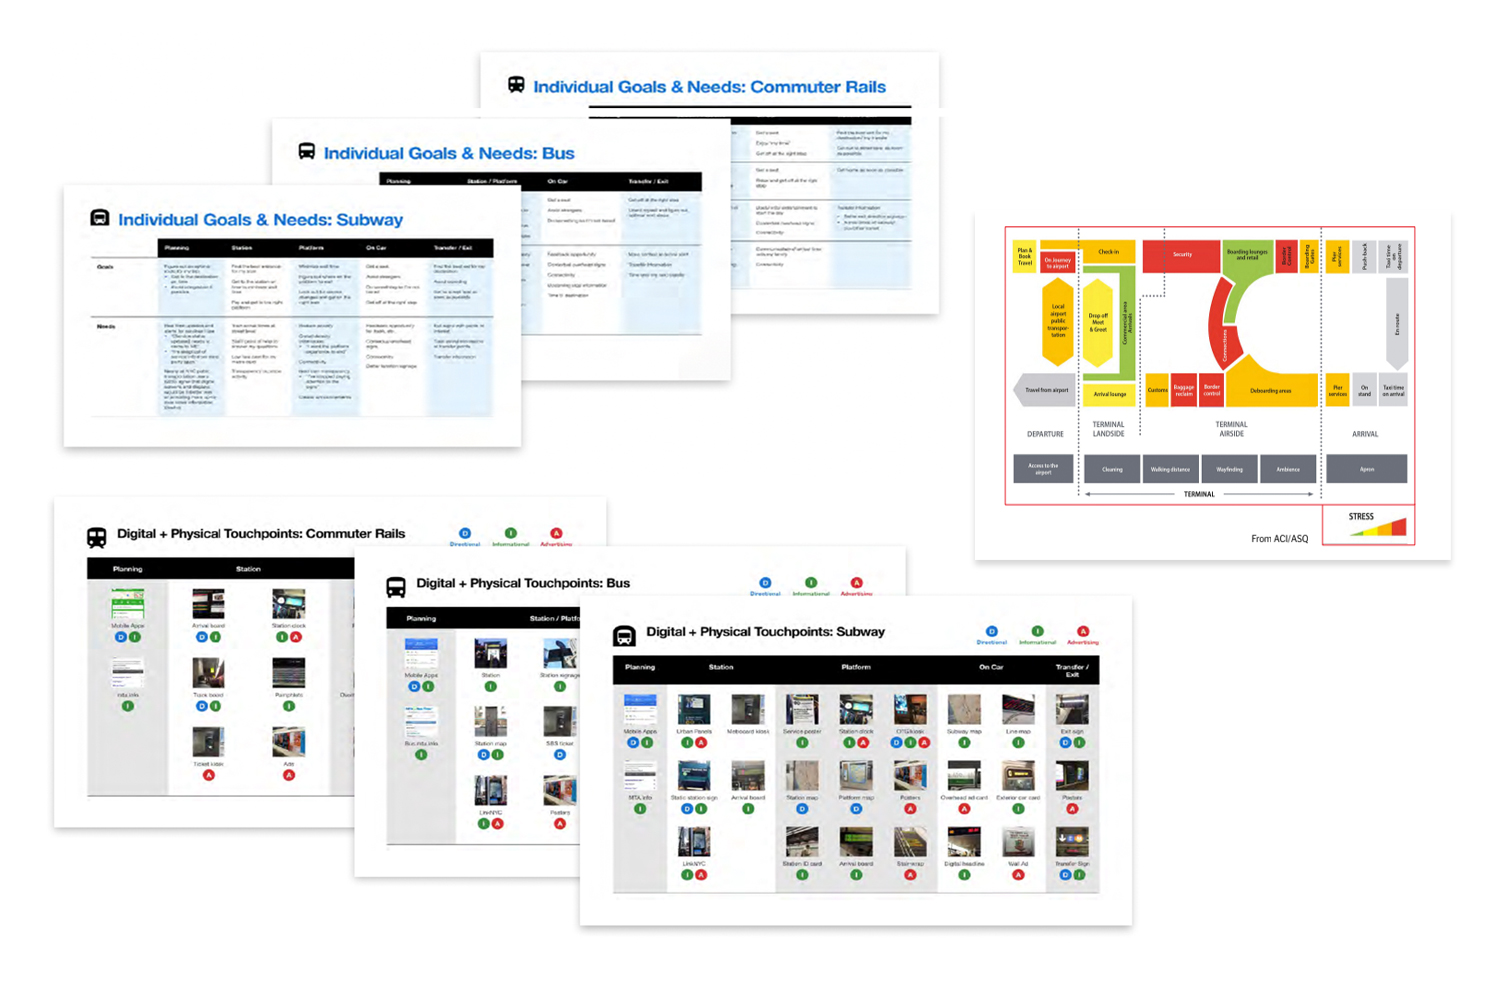
Can people move through your space efficiently and confidently? Experience Score maps every directional asset — interactive kiosks, static signage, digital displays, floor markings — against actual pedestrian flow patterns captured through computer vision. It identifies where navigation breaks down, where visitors stall or backtrack, and where the gap between a well-designed floor plan and a confusing real-world experience is costing you dwell time, concession revenue, and satisfaction scores. Key destinations including restrooms, exits, service desks, platforms, gates, and exhibit entrances are all tracked as wayfinding performance nodes.
Engage
Are your communications transforming passive movement into active participation? Experience Score assesses how effectively your digital displays, multimedia content, and interactive installations are converting footfall into engagement — and engagement into revenue. This dimension captures the difference between a visitor who walks past and one who stops, interacts, and spends. For cultural institutions it is the difference between a visitor who sees an exhibit and one who remembers it. For venues and transit hubs it is the difference between a captive audience and a revenue opportunity.
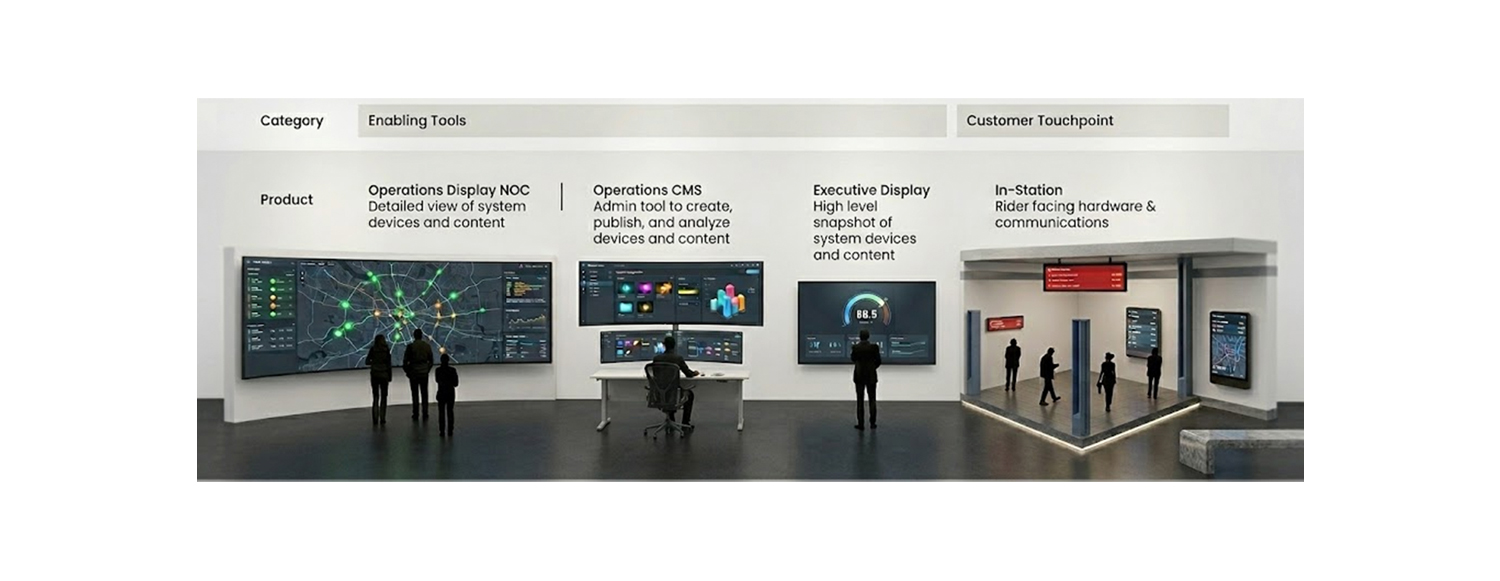
How It Works
Site Scanning Experience Score uses either in-person or computer vision audits to scan physical environments for information density across all three dimensions — assessing signage placement, visual hierarchy, pedestrian flow, and engagement effectiveness across your entire facility. Users are given survey audit tools to help them walk through and record what's working and opportunities . High-performing and underperforming environments are both ingested, analyzed, and learned from, continuously building a benchmark dataset that tells you not just where you stand but what best-in-class actually looks like.
CommAudit Engine Every communication asset — CMS APIs, digital displays, push notifications, PA scripts, exhibit labels, event listings, social posts and print posters are ingested, scored for clarity and compliance, and mapped to a specific location and journey stage. You see exactly where visitors are communication-blind at the moments that matter most.
Journey Mapper Every asset is pinned to your floor plan and tagged by visitor journey stage such as arrival, entry, navigation, retail and egress. Gap analysis reveals where the physical environment and the communications ecosystem are failing visitors..
Satisfaction Correlation NPS scores, complaint volume, dwell time, concession revenue, membership conversion, and social sentiment are correlated against Inform, Wayfind, and Engage performance data. For the first time you can draw a direct line between a wayfinding failure at the east gallery entrance and a drop in post-visit satisfaction scores.
Recommendations Playbook AI-generated content rewrites, best-practice templates calibrated by environment type and disruption scenario, multilingual compliance flags, and prioritized capital recommendations — all tied to your specific space, your specific visitors, and your specific revenue or mission outcomes.
Architectural Pre-Visualization Before a renovation breaks ground or a new communications scheme goes to print, Experience Score overlays proposed changes onto existing layouts and models in 3D walkthoughts the likely impact on Inform, Wayfind, and Engage performance. Pre-visualize capital decisions against real behavioral data before committing budget.